I’ll never forget the first time I watched a visitor click around my product page… and totally ignore the Add to Cart button.
They hovered over a product image, scrolled a bit, clicked the product title, scrolled some more… then left. No sale. No clue why.
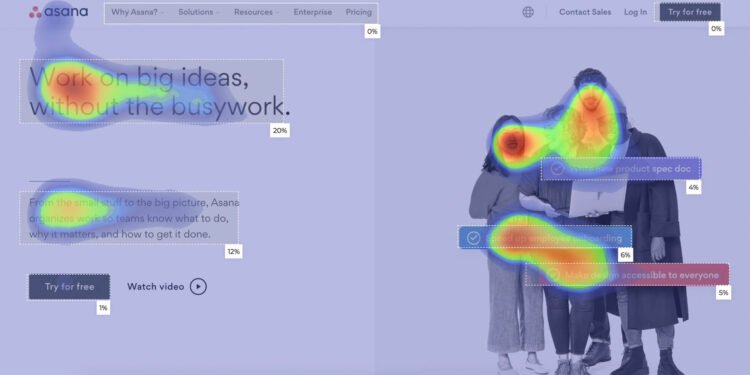
Until I saw the heatmap.
That’s when everything changed. Heatmaps showed me exactly where customers were focusing, what they were ignoring, and why they weren’t converting. If you’re serious about analyzing customer behavior to boost sales and UX, this is one of the most powerful tools you can use.
If you’re running an online store and not using heatmaps yet — trust me, you’re leaving easy sales on the table.
What Exactly Is a Heatmap?
A heatmap is like an X-ray for your website. It shows:
-
Where people click
-
How far they scroll
-
Where their mouse lingers
Think of it like a weather map, red means high activity, blue means low. You can literally see how customers interact with your pages.
There are three main types:
-
Click maps: Show where users click
-
Scroll maps: Reveal how far users scroll down the page
-
Move maps: Show where their mouse hovers or moves
It’s behavior data, visualized — and it’s gold for conversions.
Why Heatmaps Help You Sell More?
I used to redesign pages based on gut feeling. “Maybe this headline needs to be shorter?” “What if I moved the button to the left?” Total guesswork.
But with heatmaps, I could:
-
Spot dead zones (areas no one looks at)
-
Find hot spots (sections people engage with most)
-
Discover confusing clicks (people trying to click something that’s not clickable)
-
See mobile vs desktop behavior differences
And once I had that info? I made a few layout tweaks — and conversions jumped by 28%.
If you want to reduce friction and fix pages that aren’t working, you’ll also want to identify and fix sales drop-off points.
Tools That’ll Get You Started
You don’t need anything fancy to use heatmaps. These are my go-to tools:
-
Hotjar
-
Freemium plan available
-
Great for click and scroll heatmaps
-
Session recordings show full user behavior
-
-
Microsoft Clarity
-
Completely free
-
Tracks rage clicks and shows heatmaps for every page
-
Setup is super easy with a copy-paste code
-
-
Lucky Orange
-
Paid, but powerful
-
Includes live chat, session recordings, heatmaps, and conversion funnels
-
Setup usually takes 5 minutes. Paste a script into your site or integrate directly with platforms like Shopify, WooCommerce, or Payhip.
For more performance data, check out this list of best tools for store performance tracking.
What to Look For in Your Heatmaps?
Once it’s set up and you’ve collected data, here’s what I watch for:
-
Are users clicking on stuff that’s not clickable? → Fix layout confusion
-
Are they ignoring your CTA? → Reposition it or make it stand out
-
Is the scroll map cold before the pricing section? → Move pricing higher
-
Are mobile users dropping off earlier than desktop? → Test shorter content
-
Is there a cluster of clicks around images or product names? → Make those clickable or use as CTA anchors
This data shows you where friction lives and where sales are leaking out.
If you want to go deeper, consider combining this with A/B testing strategies for e-commerce success to see what truly works.
Simple Fixes That Helped My Conversions
Here are a few things I actually changed after watching heatmaps:
-
Moved my CTA button up by 300px → Clicks doubled
-
Rewrote my first 2 lines of product copy → Scroll rate improved
-
Added a review badge near my CTA → Fewer drop-offs before checkout
-
Removed distracting elements near Buy buttons → Increased focus
-
Made FAQs expandable to keep page clean → More scroll-throughs
Heatmaps don’t just show you what to fix — they show you where people care.
If you’re tracking broader funnel behavior, I also recommend learning how to track coupon code performance, those heatmaps might reveal why a promo isn’t converting like expected.
Tips for Getting the Most Out of Heatmaps
-
Run heatmaps for your top product pages first
-
Collect at least 1–2 weeks of data before making changes
-
Watch session recordings alongside heatmaps for context
-
Compare mobile vs desktop behavior, they can be wildly different
-
A/B test one change at a time so you know what actually helped
Think of it as ongoing optimization, not a one-time fix.
Final Thoughts
Heatmaps are one of the fastest, easiest ways to get inside your customer’s head.
They show you what users see, what they ignore, and where your sales are slipping away.
Once you start using them, you’ll stop guessing and start making smart, high-impact changes that boost conversions without rebuilding your whole store.
To elevate this even further, explore how conversion rate optimization ties together all these insights into a complete growth strategy.
So if you haven’t set one up yet, this is your sign. Install Hotjar or Clarity, collect some data, and let your customers show you the way.


